Before I get started I want to clearly state that I am in no way affiliated, sponsored, or endorsed with/by Palo Alto Networks. All graphics are being displayed under fair use for the purposes of this article.
I recently encountered several unpatched Palo Alto firewall devices during a routine red team engagement. These particular devices were internet facing and configured as Global Protect gateways. As a red teamer/bug bounty rookie, I am often asked by customers to prove the exploitability of vulnerabilities I report. With bug bounty, this will regularly be a stipulation for payment, something I don’t think is always necessary or safe in production. If a vulnerability has been proven to be exploitable by the general security community, CVE issued, and patch developed, that should be sufficient for acceptance as a finding. I digress…
The reason an outdated Palo Alto Global Protect gateway caught my eye was because of a recent blog post by DEVCORE team members Orange Tsai(@orange_8361) and Meh Chang(@mehqq_). They identified a pre-authentication format string vulnerability (CVE-2019-1579) that had been silently patched by Palo Alto a little over a year ago (June 2018). The post also provided instructions for safely checking the existence of the vulnerability as well as a generic POC exploit.
Virtual vs Physical Appliance
If you’ve made it this far, you’re probably wondering why there’s need for another blog post if DEVCORE already covered things. According to the post, “the exploitation is easy”, given you have the right offsets in the PLT and GOT, and the assumption that the stack is aligned consistently across versions. In reality however, I found that obtaining these offsets and determining the correct instance type and version to be the hard part.
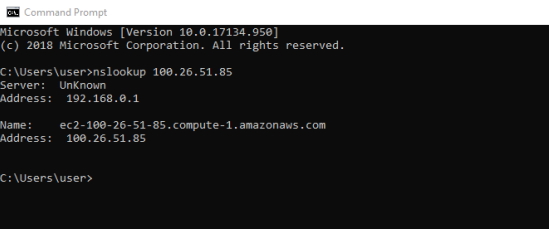
Palo Alto currently markets several next generation firewall deployments, that can be broadly categorized into physical or virtual. The focus of the exploitation details in the article are based on a virtual instance, AWS in this scenario. How then do you determine whether or not the target device you are investigating is virtual or physical? In my experience, one of the easy ways is based on the IP address. Often times companies do not setup reverse DNS records for their virtual instances. If the IP/DNS belongs to a major cloud provider, then chances are it’s a virtual appliance.
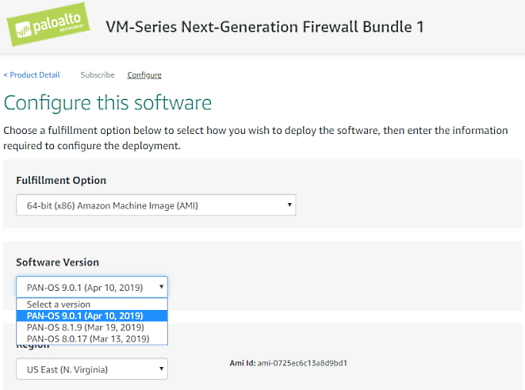
If you determine that the firewall type is an AWS instance, then head over to AWS marketplace and spin up a Palo Alto VM. One of the first things you’ll notice here is that you are limited to only the newest releases of 8.0.x, 8.1.x, 9.0.x.
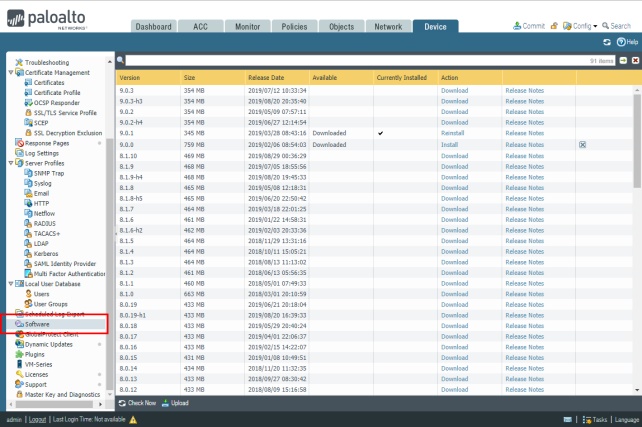
Don’t worry, you can actually upgrade and downgrade the firmware from the management web interface once it has been launched… if you have a valid support license for the appliance. There are some nuances however, if you launch 9.0.x, it can only be downgraded to 8.1.x. Another very important detail is to ensure you select a “m4” instance or when you downgrade to 8.x.x or the AWS instance will be unreachable and thus unusable. For physical devices, the firmware supported can be found here
Getting ahold of a valid support license varies in difficulty and price. If you are using the AWS Firewall Bundle, the license is included. If it’s a physical device, it can get complicated/expensive. If you buy the device new from an authorized reseller, you can activate a trial license. If you buy one through something like Ebay and it’s a “production” device, make sure the seller transfers the license to you otherwise you may have to pay a “recertification” fee. If you get really lucky and the device you buy happens to be a RMA-ed device, when you register it it will show as a spare and you get no trial license, you have to pay a fee to get it transferred to production, and then you have to buy a support license.
Once you have the appliance up and running with the version you want to test, you will need to install a global protect gateway on one of the interfaces. There’s a couple youtube videos out there that go over some of the installation steps but you basically just have to step your way through it until it works. Palo Alto provides some documentation that you can use as a reference if you get stuck. One of the blocking requirements is to install a SSL certificate for the Global Protect gateway. The easiest thing here is to just generate a self signed certificate and import it. A simple guide can be found here. Supposedly one can be generated on the device as well.
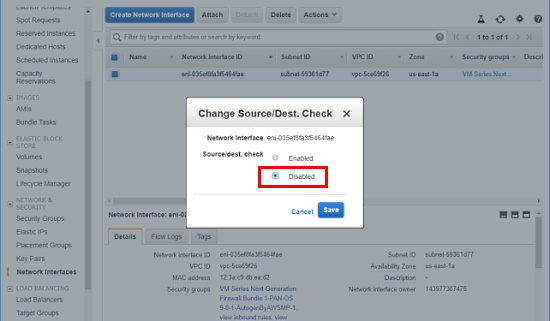
If you are setting up an AWS instance, you will need to change a key setting on the network interface or the global protect gateway will not be accessible. Goto the network interface that is being used for the Global Protect interface in AWS. Right click and select “Change Source/Dest Check”. Change the value to “Disabled” as shown below.
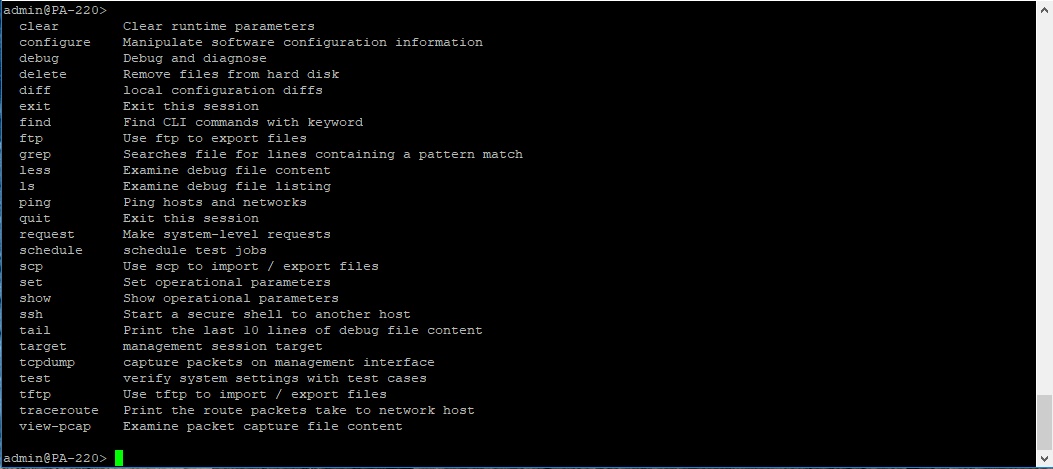
Alright, the vulnerable device firmware is installed and the global protect gateway is configured, we’re at the the easy part right??? Well not exactly… When you SSH into the appliance you’ll find you are in a custom restricted shell that has very limited capabilities.
In order to get those memory offsets for the exploit we need access to the sslmgr binary. This is going to be kinda hard to pull off in a restricted shell. Previous researchers found at least one way, but it appears to have been fixed. If only there was another technique that worked, then theoretically you could download each firmware version, copy it from the device, and retrieve the offsets.
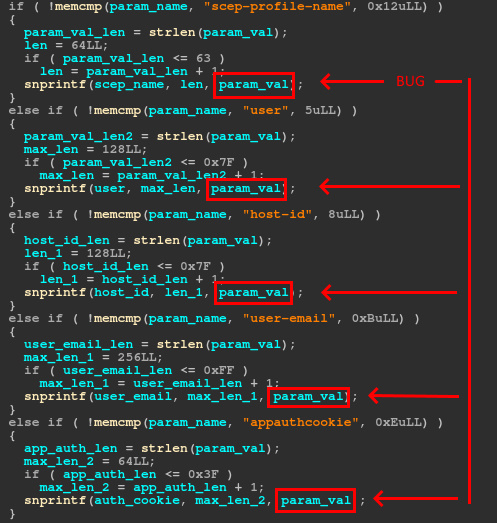
What do we do if we can’t find such a jailbreak… for every version??? Well it turns out we may be able to use some of the administrative functions of the device and the nature of the vulnerability to help us. One of the features that the limited shell provides is the ability to increase the verbosity of the logs generated by key services. It also allows you to tail the log files for each service. Given that the vulnerability is a format string bug, could we leak memory into the log and then read it out? Let’s take a look at the bug(s).
And immediately following, is the exact code we were hoping for. It must be our lucky day.
So as long as we populate those four parameters, we can pass format string operators to dump memory from the process to the log. Why is this important? This means we can dump the entire binary from memory and retrieve the offsets we need for the exploit. Before we can do that, first we need to identify the offsets to the buffers on the stack for each of our parameters. I developed a script that you can grab from Github that will locate the specified parameters on the stack and print out the associated offsets.
The script should output something like the screenshot below. Each one of these offsets points to a buffer on the stack that we control. We can now select one and populate it with whatever memory address we like and then use the %s format operator to read memory at that location.
As typically goes, there are some problems we have to work around to get accurate memory dumps. Certain bad characters will cause unintended output: \x00, \x25, and \x26.
Null bytes cause a problem because sprintf and strlen recognize a null byte as the end of a string. A work around is to use a format string to point to a null byte at a known index, e.g. %10$c.
The \x25 character breaks our dump because it represents the format string character %. We can easily escape it by using two, \x25\x25.
The \x26 character is a little trickier. The reason this character is an issue is because it is the token for splitting the HTTP parameters. Since there aren’t a prevalence of ampersands on the stack at known indexes, we just write some to a known index using %n, and then reference it whenever we encounter an address with a \x26.
Putting this all together, I modified my previous script to write a user-supplied address to the stack, deference it using the %s format operator, and then output the data at that address to the log. Wrapping this logic in a loop combined with our handling of special characters allows us to dump large chunks of memory at any readable location. You can find a MIPS version of this script on our Github and executing it should give you output that looks something like the screenshot below.
Now that we have the ability to dump arbitrary memory addresses, we can finally dump the strlen GOT and system PLT addresses we need for the exploit, easy… except, where are they??? Without the sslmgr binary how do we know what memory address to start dumping to get the binary? We have a chicken or the egg situation here and the 64 bit address space is pretty big.
Luckily for us, the restricted shell provides us one more break. If a critical service like sslmgr crashes, a stack trace and crash dump can be exported using scp. At this point I’ve gotten pretty good at crashing the service so we’ll just throw some %n format operators at arbitrary indexes.
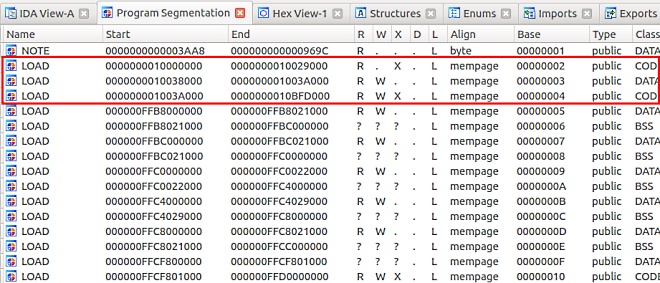
I learned something new about IDA Pro during this endeavor. You can use it to open up ELF core dumps. Opening up the segmentation view in IDA we could finally see where the binary is being loaded in memory. Another interesting detail we noticed while debugging our payloads was that it appeared ASLR was disabled on our MIPS physical device as the binary and loaded libraries were always loaded at the same addresses.
Finally, let’s start dumping the binary so we can get our offsets. We have roughly 0x40000 bytes to dump, at approximately 4 bytes/second. Ummm, that’s going to take… days. If only there was a shortcut. All we really need are the offsets to strlen and system in the GOT and PLT.
Unfortunately, even if we knew exactly were the GOT and PLT were, there’s nothing in the GOT or PLT that indicates the function name. How then does GDB or IDA Pro resolve the function names? It uses the ELF headers. We should be able to dump the ELF headers and a fraction of the binary to resolve these locations. After an hour or two, I loaded up my memory dump into Binary Ninja, (IDA Pro refused to load my malformed ELF). Binary Ninja has proven to be invaluable when analyzing and manipulating incomplete or corrupted data.
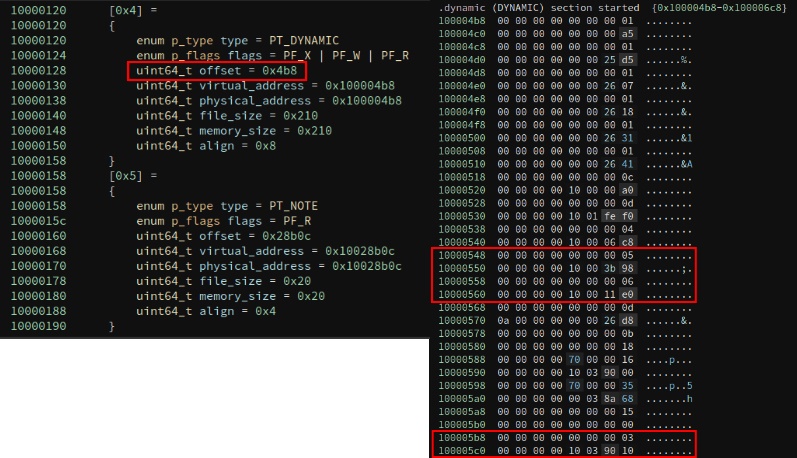
A little bit of research on ELF reveals that the PT_DYNAMIC program header will hold a table to other sections that hold pertinent information about an executable binary. Three of which are important to us, the Symbol Table (DT_SYMTAB-06), the String Table (DT_STRTAB-05), and the Global Offset Table (DT_PLTGOT-03). The Symbol Table will list the proper order of the functions in the PLT and GOT sections. It also provides an offset into the String Table to properly identify each function name.
With the offsets to the SYMBOL and STRING tables we can properly resolve the function names in the PLT & GOT. I wrote a quick and dirty script to parse through the symbol table dump and output a reordered string table that matches the PLT. This probably could have been done using Binary Ninja’s API, but I’m a n00b. With the symbol table matched to the string table, we can now overlay this with the GOT to get the offsets we need for strlen and system. We have two options for dumping the GOT. We can either use the crash dump from earlier, or manually dump the memory using our script.
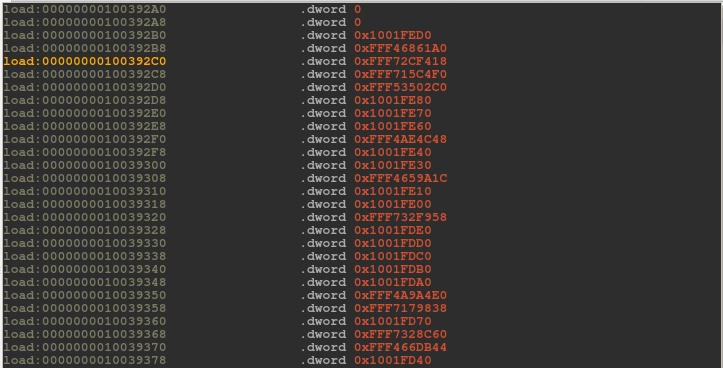
I decided to go with the crash dump to save me a little time. The listing above shows entries in the GOT that point to the PLT (0x1001xxxx addresses) and several library functions that have already been resolved. Combined with our string table we can finally pull the correct offsets for strlen and system and finalize our POC. Our POC is for the MIPS based physical Palo Alto appliance but the scripts should be useful across appliance types with minor tweaking. Wow, all done, easy right?
While the sslmgr service has a watchdog monitor to restart the process when it crashes, if it crashes more than ~3 times in a short amount of time, it will not restart and will require a manual restart. Something to keep in mind if you are testing your shiny new exploit against a customer’s production appliance.

