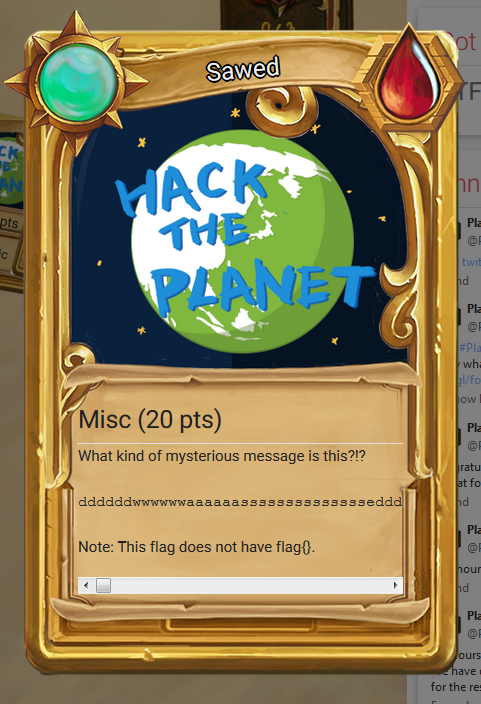
At first glance the string appeared to be some kind of encoding, but what encoding only uses 5 characters. After further inspection, I recognized the characters as the ones that are commonly used for movement in computer games. The only key I wasn’t sure about was the ‘e’ key. I googled a little bit and ran upon this page.
http://en.wikipedia.org/wiki/Arrow_keys#WASD_keys
Primarily, WASD is used to account for the fact that the arrow keys are not ergonomic to use in conjunction with a right-handed mouse. This also allows the user to use the left hand thumb to press the space bar (often the jump command) and the left hand little finger to press the Ctrl or ⇧ Shift keys (often the crouch and/or sprint commands). In later games, the usage of the E key to interact with items or open up the inventory was also popularized due to its location next to the WASD keys, allowing players to reach it quickly.
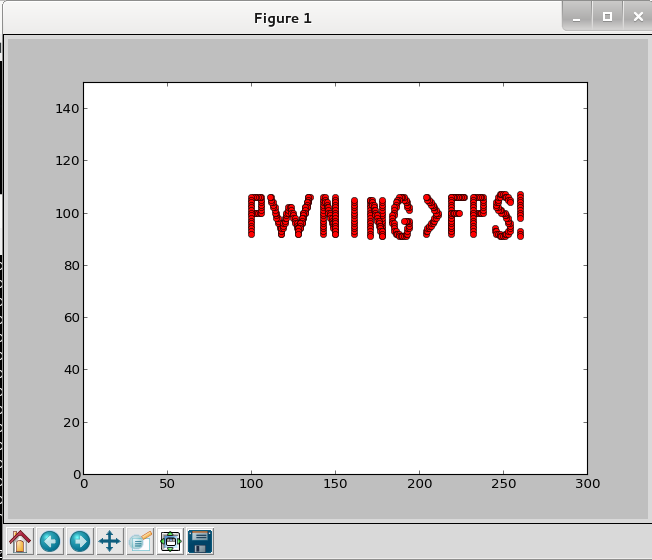
I quickly spotted this as some kind of path for drawing something, with the ‘e’ as the action to start and stop the drawing. Luckily I had some code from a similar challenge for Boston Key Party so I modified it to work for this one.
import matplotlib.pyplot as plt

data = 'ddddddwwwwwwaaaaaasssssssssssssseddddd'
data += 'dddddddddddddewwawwawwawwawwawwawwaed'
data += 'ddssssssddddssssssssewwdwwdwwdwwdwwddss'
data += 'dssdssdssdsswwdwwdwwdwwdwwdwwdwwdassas'
data += 'sassassassassassedddddddddddddddewwww'
data += 'wwwwwwwwwwdssdssdssdssdssdssdsswwwww'
data += 'wwwwwwwwwsssssssssssssseddddddddddde'
data += 'wwwwwwwwwwwwweddddddddddesssssssssssssse'
data += 'dddddddewwwwwwwwwwwwwweaaaaaaaedssdssds'
data += 'sdssdssdssdssewdwdwdddwddwdwwddwddwddwdd'
data += 'ewawwawawaaasasassasssasssdsssdsddsddddw'
data += 'dwwdwwwaaaessdddsddsddddsddddewdwdwdwdwdw'
data += 'dwdwawawawawawawaedddddddddddddddedddd'
data += 'ddddaaaaaaaasssssssssssssswwwwwwwwddddded'
data += 'dddddddeddddddwwwwwwaaaaaassssssssssss'
data += 'ssedddddddddddddwwesdsddsdddwddwdwwwaww'
data += 'awawaawaawawwdwwdwdddsddsdsedddwwwdddess'
data += 'sssssssesssssess'

x = 100
y = 100

plot = 1
for a in data:

if a == 'd':
   x += 1
elif a == 'a':
   x -= 1
elif a == 'w':
   y += 1
elif a == 's':
   y -= 1
elif a == 'e':
   if plot == 0:
      plot = 1
   else:
      plot = 0

if plot == 1:
   plt.plot(x, y, 'ro')

plt.axis([0, 300, 0, 150])
plt.show()
Running the above python script produces our flag.

