Before I dive deep into a technical write-up, I first wanted to give a quick summary of what this post is going to cover for those that may want to skip around. This article is in reference to the disclosure posted here. I’m going to start by reviewing past work on the MEDCIN application and how I got here. Second, I’m going to explain the vulnerabilities I found and the memory protections that were in place in the binary. Lastly, I’m going to detail the exploit primitives I had to chain together to achieve code execution. I also intend on introducing a memory visualization tool I created that greatly improved the reliability of the final exploit.
Several months back, I came across a vulnerability found during a security assessment in an outdated version of the MEDCIN engine. After reporting the vulnerability to the vendor and being notified that the bug had been patched in the most recent version, I proceeded to review the latest code for any additional software flaws.
I initially began investigating this application for vulnerabilities because it was a prime target for exploitation for several reasons. It processes incoming messages from remote clients without authentication, and runs as a service with SYSTEM level privilege on Windows. The original binary also lacked any compile-time memory protections.
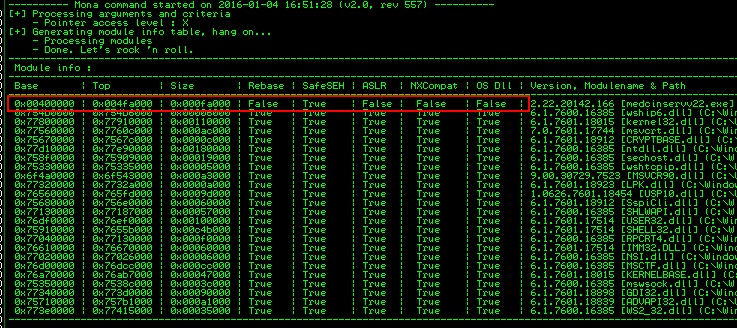
Given the absence of compile-time protections initially, the first thing I checked was whether the developers had included them in the newest build. Taking a quick look at a couple of arbitrary functions, I was able to see that stack cookies had been added and the following screenshot from mona indicates the binary was compiled with SafeSEH as well. With these new protections in place, any stack-based buffer overflows discovered will be more difficult to exploit.
The next step in my research was to begin tracing through the various message parsing routines that I had briefly investigated in the original executable. Using work done on the previous binary, I was able to quickly script up a simple fuzzer to begin supplying random data to the application service. After several weeks of fuzzing and static analysis I came up with roughly 8 vulnerabilities that could possibly lead to code execution. These bugs included stack, heap, and data section buffer overflows, a memory disclosure, and a partially controlled arbitrary memory write.
CVE-2015-2898
With a basket full of exploit primitives to investigate, I decided to begin researching the stack-based buffer overflows I had discovered first. Review of each of them yielded little. The combination of stack cookies and SafeSEH compiled binaries gave little option for wrangling control of execution from the application. I decided without some way of leaking the stack cookie, I would be unable to use the vulnerabilities for an exploit… on to the next.
CVE-2015-2901
The next bug I began researching was what appeared to be a string concatenate buffer overflow into the data section, that was then leaked back across the socket. This vulnerability seemed very promising as I could not only overwrite the entire data section but also leak memory addresses from the data section back to me. Unfortunately, this vulnerability came with a significant constraint, I was only able to overwrite null bytes in the data section. The following is pseudo-code of the vulnerable function.
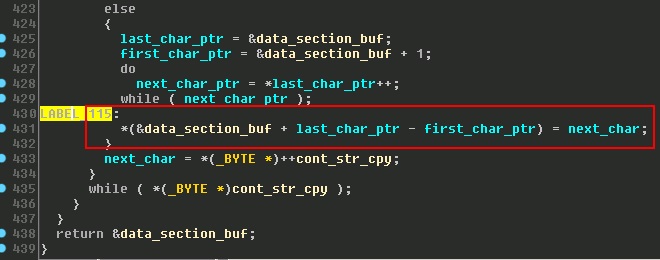
After a significant amount of time and effort, I was unable to reliably gain control of execution using only this vulnerability. I found that there was only a small window of time between when the data section was corrupted and the application crashed. Unfortunately, these crashes were random and often unexploitable. I was unable to leak back the stack cookie or any stack addresses. I was however, able to leak a significant number of heap addresses that I would find later to be quite useful.
CVE-2015-2900
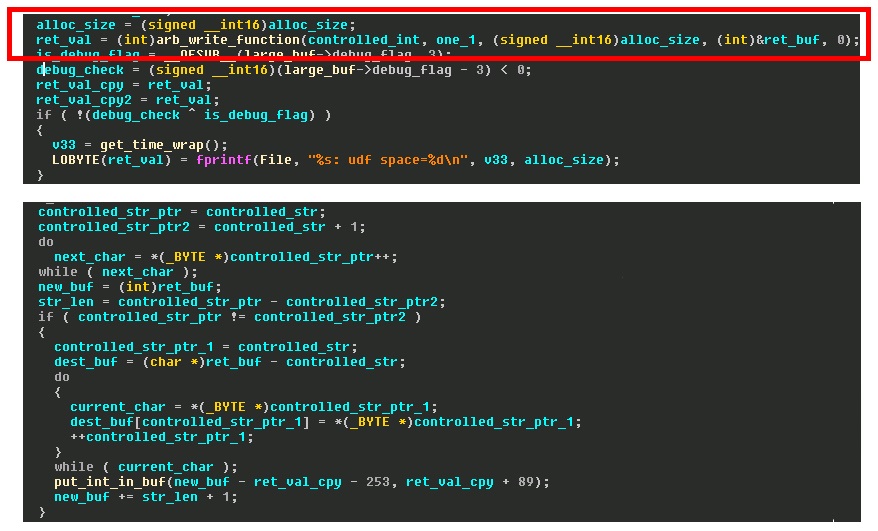
With one useful exploit primitive acquired, I moved on to the partially controlled arbitrary memory write vulnerability. This particular bug was discovered from a crash while running my dumb fuzzer. It appeared to be from a user controlled index (signed integer) added to a heap pointer address that resides in the data section. The containing function failed to validate whether the passed integer was greater than zero. The reason I refer to this vulnerability as partially controlled is because the heap address the index is being added to, is dynamic. Here’s some pseudo-code showing the bug.

After some investigation, I discovered that the heap address that is added to our controlled index is located below our string concatenate buffer from CVE-2015-2901. This means that we can leak this address and fully control where this write is happening. As you can see from the code snippet, the value being written is a heap pointer that was allocated just prior to the arbitrary write. We now have the beginnings of an exploit chain!!
So now that we know we can write a pointer almost anywhere in memory, the next step is to determine if we control the data being pointed to and locate a useful destination address to overwrite with our pointer. In a perfect scenario, we would overwrite a function pointer and then trigger a call to gain code execution. This assumes however, that the data being pointed to is controlled and executable.
Searching through the binary, I was able to locate only a handful of function pointers that were located at static locations. Lucky for us, one of these function pointers is directly accessible from one of the message parsing functions. At this point I decided to cobble together everything I had so far and throw it at the application. To my amazement, it appears that we have achieved code execution on the heap.
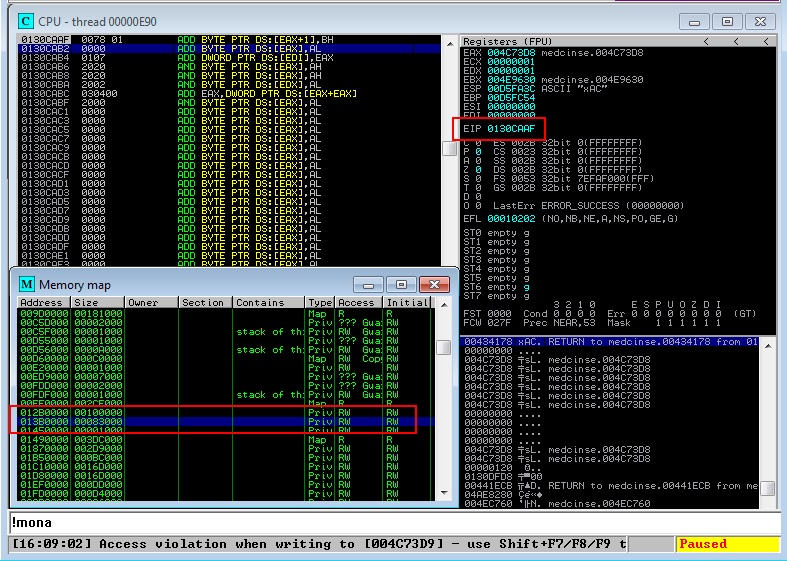
The reason this works is because the application was not compiled with data execution prevention and I am testing in Windows 7 with DEP set to “Opt In”. Most people remember DEP disables execution on the stack, but it also protects the heap.
Having achieved code execution, I now had to figure out how much control I had over the data being pointed to by our overwritten function pointer. Reviewing the surrounding code, I found that I do control a good portion of the buffer but it’s at over 0x100 bytes into the buffer. The beginning of the buffer was only partially controllable and every permutation I tested to jump to our controlled section in the buffer failed. Can we use another bug to help us out???
CVE-2015-2899
It appears the last hurdle to overcome to achieve reliable code execution is to somehow control the data being pointed to by our overwritten function pointer. Since our data resides on the heap, the next logical step is to see if I could somehow overflow a heap allocation directly above our target buffer and thus fill it with controllable data. Fortunately for us, we happen to have a heap buffer overflow in our bag of exploit primitives.

As can be seen in the pseudo-code above, we have a classic heap buffer overflow because the destination buffer size is static and the source string size is not checked. My goal is to try and groom the heap in such a way that an overflow of this memory allocation will spill over into my target allocation, so execution of my overwritten function pointer will land us in controlled data.
In order to groom the heap, I need the ability to make memory allocations that will persist and not be freed, preferably of a controlled size. Searching through the different message parsing functions I was able to find one such function that would allow me to allocate memory chucks of whatever size I needed. Without having done any real research on the Windows 7 heap allocator up to this point, I begin testing different sizes and numbers of allocations to see if I could land my exploit with consistency. The general structure of my POC is as follows.
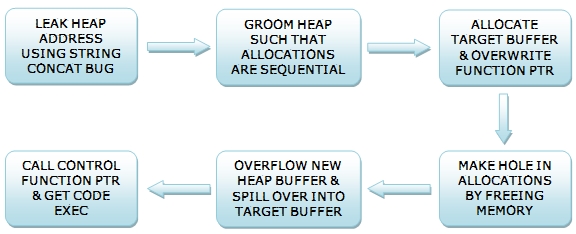
As one would expect, with little knowledge of the inner workings of the Windows 7 heap allocator, my results were quite unreliable. In addition, I had little insight into what other memory allocations and frees were going on in the application that were outside my control. Naturally this led me to searching for a tool that would monitor the allocations and frees being performed by the allocator, preferably a visual tool.
Digging around online for a heap monitoring tool turned up a few options. Unfortunately, the options I found weren’t exactly what I wanted. They either took snapshots of memory and you later analyzed them, displayed a GUI on the same system as the target (which could be a problem if the system is headless or has limited RAM), or were embedded in a debugger. I also wanted the function hooking library to be non-proprietary and work for 64bit, aka not Microsoft Detours.
Although not meant for software exploitation like the previous examples, I found some source code online for a tool called Heapy. To my delight, it used an open source hooking library called MinHook for function hooking and supported both x86 and x64 architectures. It also had sample code for hooking malloc and free. This looked like a great candidate for getting me started on my new tool.
Heap Monitor
With a list of requirements for a new heap allocation visualization tool and some sample code, I began implementing HeapMonitor ( I’m horrible at naming things ). I first added code to the DLL injector for attaching to a service level process. Next, I switched out the logic for writing the hooking details to a file and instead sent it over a socket. This would allow me to have the visualization GUI on any other system on the network. I also decided to attach a stack trace with each hooked allocation and free so it would be easy to trace what functions where responsible for the calls.
I decided to write the GUI in Java given the ease of development and my familiarity. I organized the GUI such that allocations and frees would be displayed in real-time in a list on the right. The main GUI frame displays a block-level view of a memory page and also fills and empties according to the messages coming in. The second tab on the main frame displays the stack trace for any selected allocations or frees in the list. Given the possibility of large gaps in allocated memory pages, I also added a memory navigation bar at the top that can be selected to quickly navigate through memory.
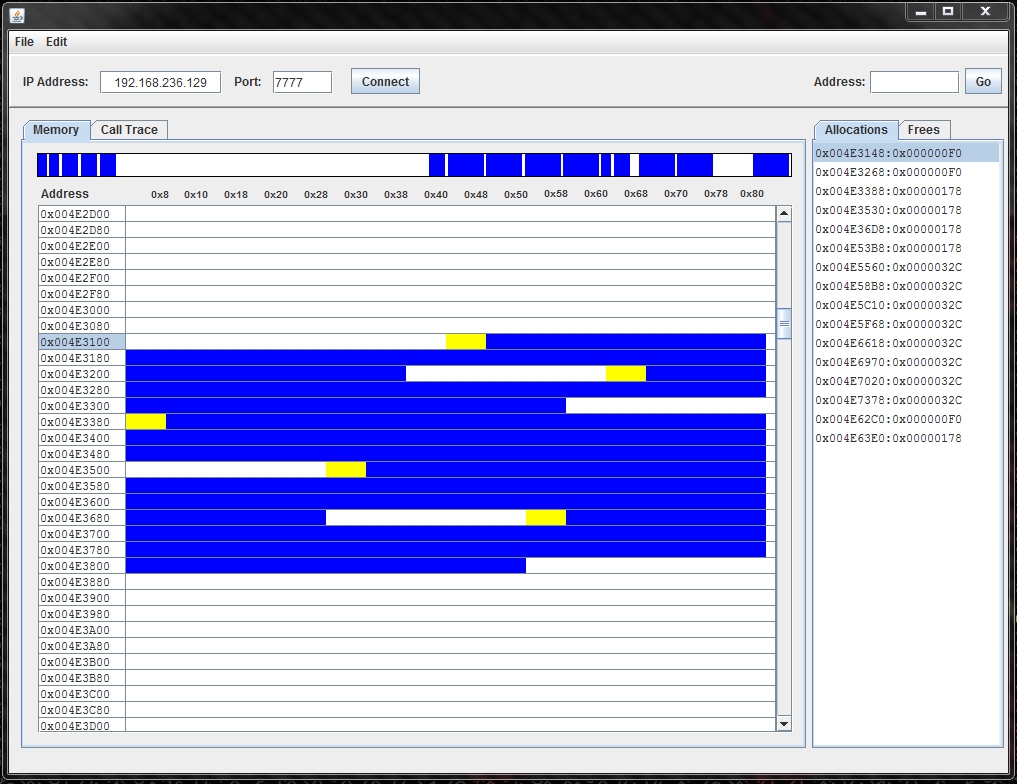
To get a better handle on the inner workings of the Windows 7 heap allocator, I started reading up on all the papers I could find by security researchers. The most useful were Chris Valasek’s “Understanding the Low Fragmentation Heap”, Steven Seeley’s “Ghost in the Seven allocator”, and Jeremy Fetiveau’s “Exploiting the Low Fragmentation Heap for fun and profit”. Using my heap visualization tool, I was able to confirm their research about the Windows 7 allocator and the low fragmentation heap.
CVE-2015-6006
One of the main problems that I discovered with my current exploit chain was whenever I tried to setup my allocations to be sequential, they would always be off by at least 0x1000 bytes. This meant that my heap overflow had to be rather large and it only landed about 50% of the time. After reading the latest research on the heap allocator in Windows 7, I realized this was because the low fragmentation heap was being enabled, but for two different size allocations. I was also able to visually confirm this using the Heap Monitor tool. However, I was unable to make them the same size because CVE-2015-2899 is static, 0xF0, and CVE-2015-2900 has to be at least 0x100, (passed_alloc_size + 0x100). *Both of these allocation sizes can be seen in the screen shots for each respective vulnerability.
I had about conceded defeat to achieving ~100% reliability when I came across the final piece of my exploit chain. It just so happened that the calling function to my arbitrary write vulnerability (CVE-2015-2900) had a second bug. It truncated the length of user supplied data to a 16bit signed short before passing it to the arbitrary write function to allocate a buffer. After the function returned, it then proceeded to string copy all of the user data into the newly created buffer. This meant we could supply a string that was greater than MAX_SHORT and cause a heap overflow in the subsequent string copy. It also means we can control the size of the allocation. Pseudo-code of the vulnerability is listed below.
